There are several different ways to search for statistical information within Matrix. This article will help differentiate between using the Stats button in the Actions bar and the Stats option in the main menu bar at the top of Matrix.
Actions Bar
The
Stats
button in the Actions bar (also referred to as Quick Stats) is not available until you have first performed a search and are viewing your results.
For instance, if you run a Residential search and are viewing the matches in the Agent Single Line, you will see the Stats button in the same bar as Email, Print, Quick CMA, etc.:

When you click the Stats button, you will see the following options:
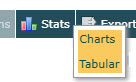
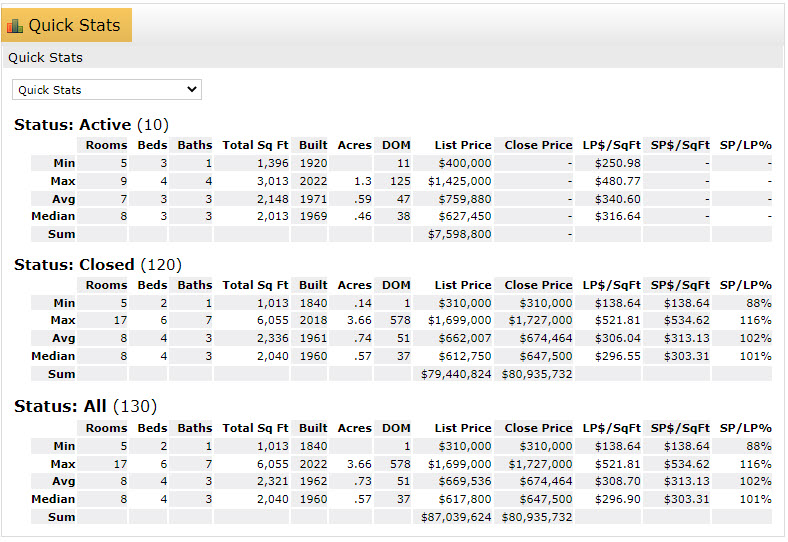
- Tabular is available if you have selected at least one or more of your search results. It generates a quick, simple statistical breakdown of the selected listings ( Quick Stats ):
-
Charts
is available only if you have not selected any of the listings in your search results.
It opens up a stats search screen that populates the criteria from your original search:
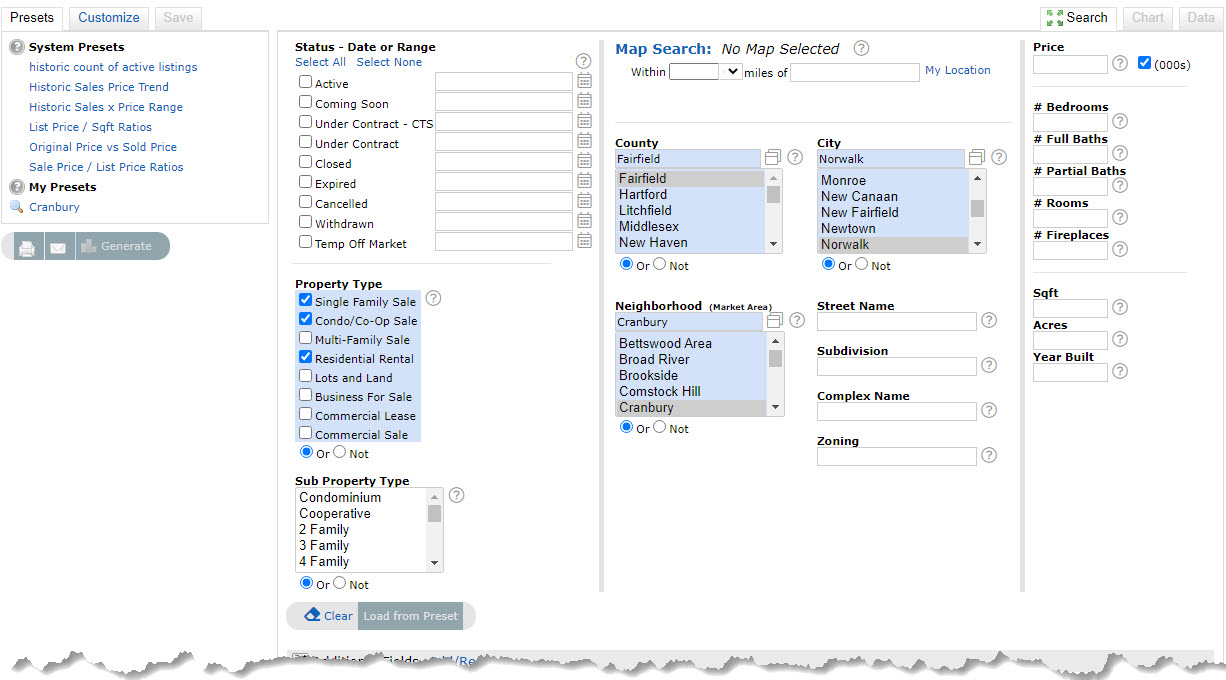
At this point, you could enter additional criteria (if needed) and then choose from an array of statistics in the upper right:
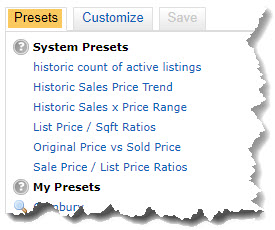
The Presets section gives you a handful of system preset statistical reports (see above image).
Click the Customize button to generate a customizable statistical report. You can set a time frame and then choose from about 20 different statistics:
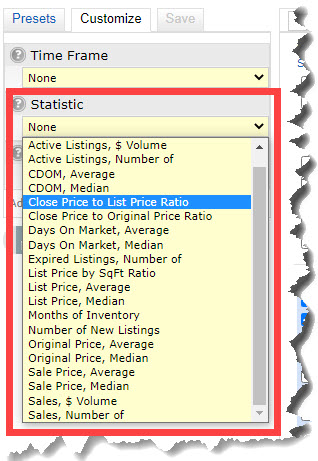
After you have made selections in Time Frame , Statistic and Group By , click Generate .
The results typically display in a chart. You can see the actual number of listings that the chart represents either by putting your mouse cursor over the individual bar/point on the graph you are interested in:

or by clicking the Data tab in the upper right corner of the graph:

You can also print the chart and data if you would like.
From the Matrix main menu
:
There is also Stats option in the Matrix main menu bar:
This will open up the same stats search screen as described above, but this time it will be completely empty since you are at the very beginning of your search:
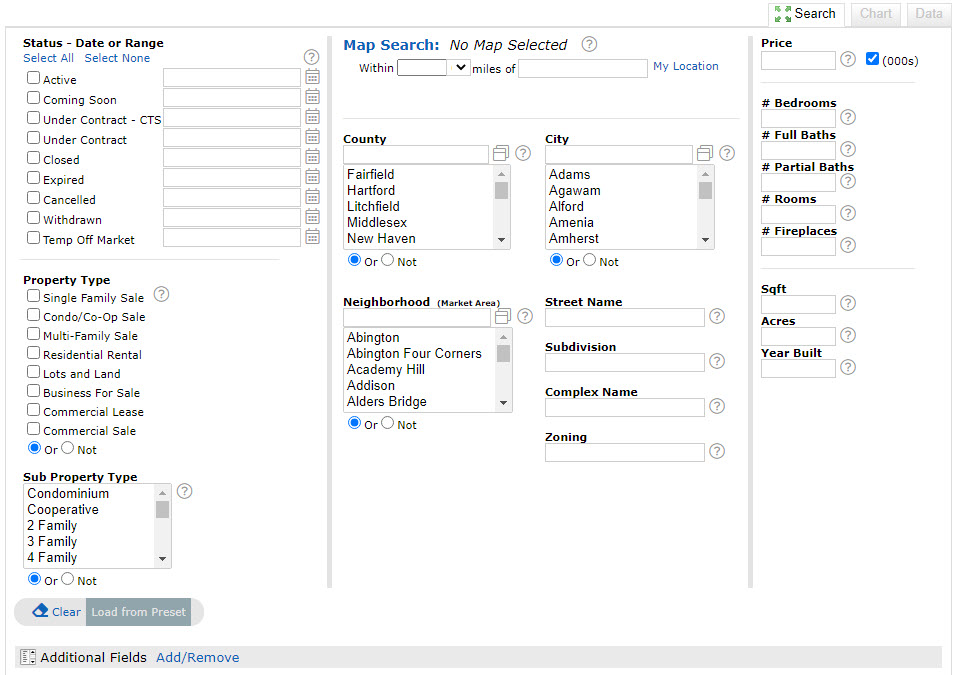
Select the type of statistic you are looking for from either the Presets or Customize tabs in the upper left. Enter your specific criteria (status, property type, area, etc.) and click Generate .
The results typically display in a chart. You can see the actual numbers that the chart represents either by putting your mouse cursor over the individual bar/point on the graph you are interested in:
or by clicking the Data tab in the upper right corner of the graph:
You can also print the chart and data if you would like.
Comments
Please sign in to leave a comment.