There are a couple different places in Matrix where you can see a ratio comparison between the list and closed prices for a property that has been marked Closed. You need to be mindful of where you are, because the list price that is used in this ratio can differ.
If you are in the Quick CMA, the ratio is based on the Original List Price. If the listing has changed prices throughout its life cycle, this price will differ from the current list price (the price the property was at when the listing went off the market).
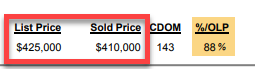
In this example, the property was listed at $465,000, went through a couple of decreases and sold for $410,000. The 88% represents the comparison of the Original List Price and the Closed Price (even though the chart is showing the current list price):
If you are Tabular Stats (when you click on Stats in the Actions Bar at the bottom of a Matrix display), the ratio uses the current list price (the list price of the property when it went off market) when calculating the ratio.
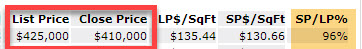
Using the same listing as in the previous example, here is the ratio generated from Tabular Stats. It is calculated by dividing the closed price ($410,000) by the property's list price at the time the listing went off the market ($425,000):
So, depending on where you are in Matrix, be cognizant of the figures that are being used to calculate ratios or other statistics.
Comments
Please sign in to leave a comment.