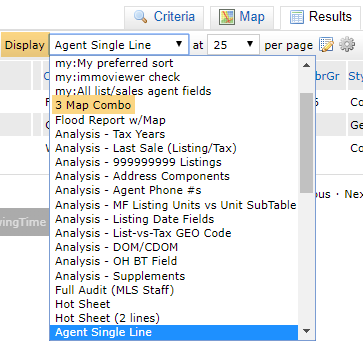
In January 2020, SmartMLS deployed a new interactive map display for both listing and tax data- the 3 Map Combo. It is located at the top of the Display drop down menu (right beneath any custom displays you have created):
The 3 maps that comprise the display- Flood Map, Property Dimensions and Interactive Map, are all interactive. You can zoom in/out and drag the map in all directions.
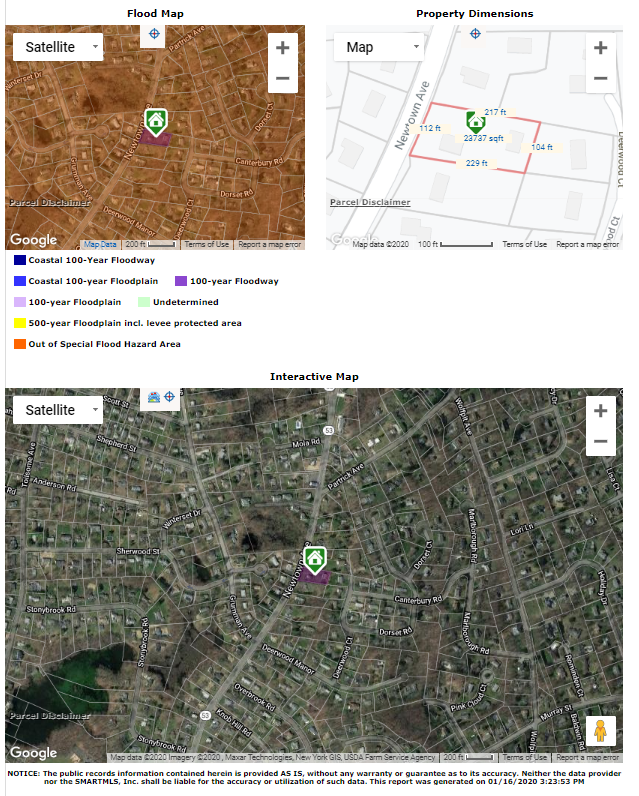
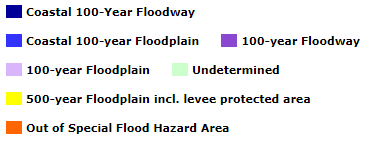
- With the Flood Map, you may have to zoom in a little bit in order to see the flood layers. There will be a legend beneath the map that explains what each color represents:
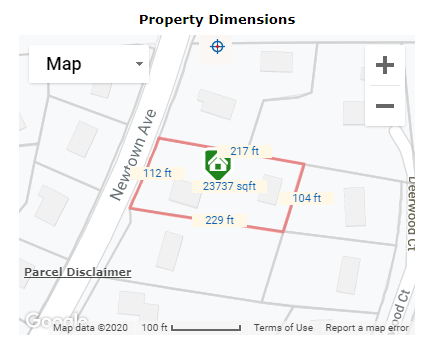
- The Property Dimensions map is designed to outline the parcel and give you the dimensions (in feet) of the lot. As with the Flood Map, you may also have to zoom in to see the lot dimensions.
- The Interactive Map includes a layers menu towards the top left (the icon to the left of the bullseye) that allows you to apply many different layers on the map:
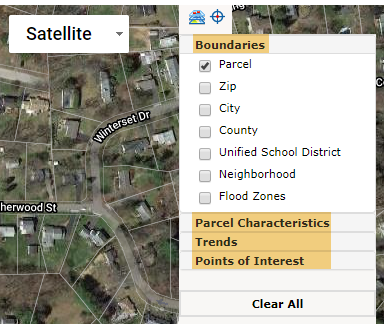
- Each of the four sections (Boundaries, Parcel Characteristics, Trends and Points of Interest) can be expanded to reveal many different layers.
- When applying layers to the map, you may have to change your zoom level in order to see them.
The 3 Map Combo can be printed and emailed.
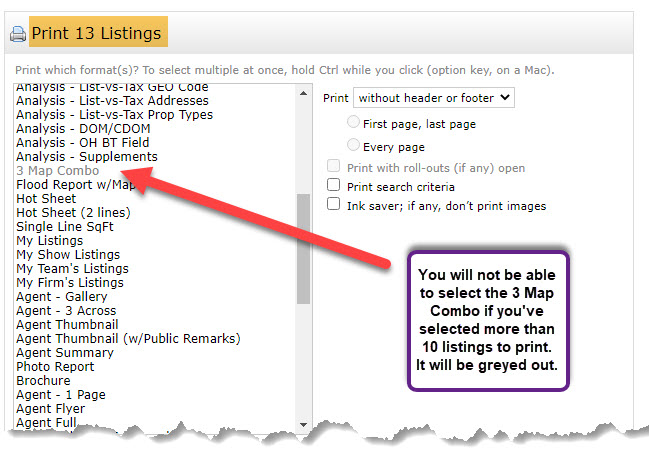
Note: when printing, you are limited to 10 listings at a time. If you have selected more than 10 listings, the 3 Map Combo option will be greyed out:
The 3 Map Combo report can also be accessed by your clients in their Matrix Portals.
Comments
Please sign in to leave a comment.